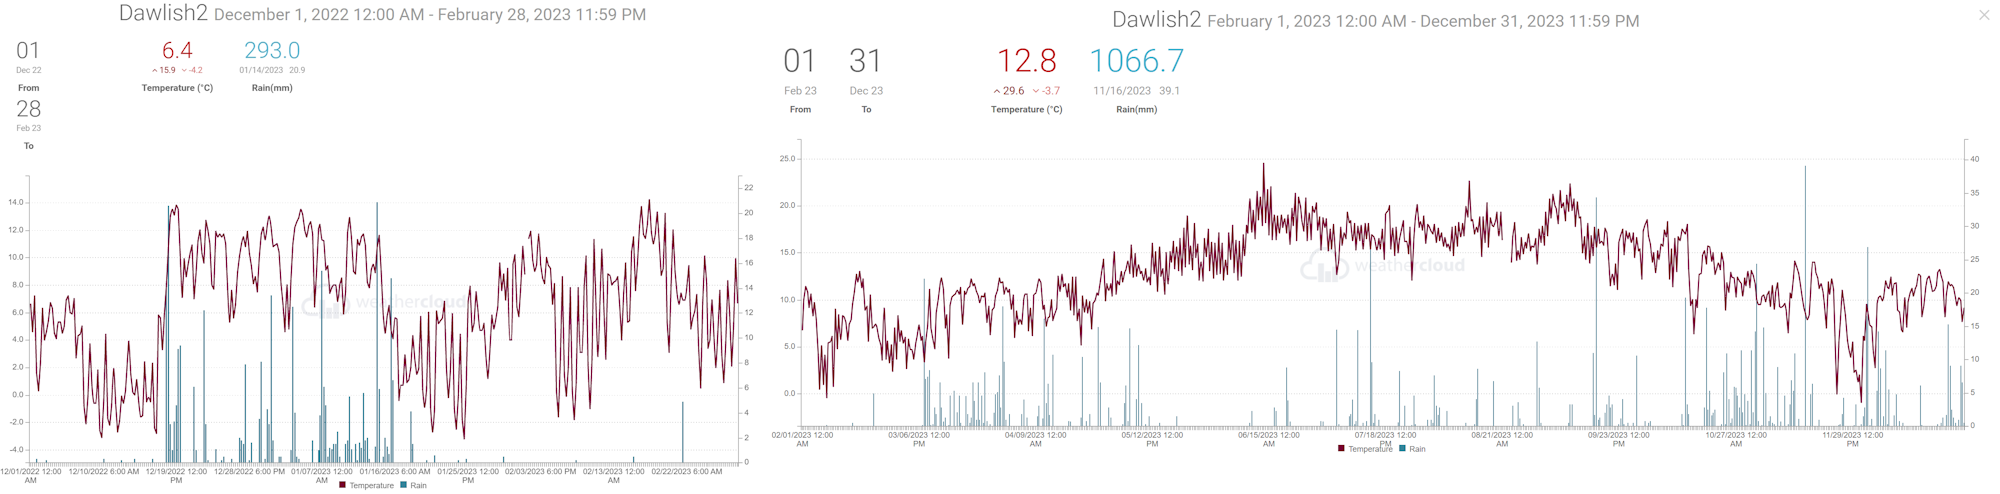
When shown * estimates were made using reports from nearby sites in order to calculate missing data. Grass frost estimates use air temp below 4C
Exminster.
Average temp 9.3C. Air frost 1day. Ground frost possible 7 days. Highest (suspect 19C) on 5th?. Lowest -2.8C morning of *25th.
0 days with 20C or more. 0 days with 25C or more.
Total rain 152.4mm. 8 dry days, 19 days, with 1mm or more, 4 days 10mm or more, 2 days 20mm or more. Wettest day 40.4 on 2nd.
Dawlish inland.
Average temp 9.4C. Air frost 1 day. Ground frost possible 5 days. Highest 15.8C on 18th. Lowest -2C morning of 25th.
0 days with 20C or more. 0 days with 25C or more.
Total rain 169mm. 8 dry days, 17 days with 1mm or more, 5 days 10mm or more, 3 days 20mm or more. Wettest day 38mm 16th .
Digital sun 50.2 hours (correction factor 0.0) = 50.2 hours.
Snow fell on 30th no accumulation
Holcombe.
Average temp 9.4C. Air frost 1days. Ground frost possible 5 days. Highest 15C on 18th. Lowest -1.2C morning of 25th.
0 days with 20C or more. 0 days with 25C or more.
Total rain 132mm. 9 dry days, 17 days, with 1mm or more, 3 days 10mm or more, 2 days 20mm or more. Wettest day 28mm on 16th.
Teignmouth Den*.
Mean temperature 9.6C (LTA 9.2C). Average Max 12.8C (LTA 12.1C). Highest 15.7C on 18th. Average Min 6.4C (LTA 6.4C). Lowest -1.3C on 25th. Air frost 1. (Average 1). Potential 4 ground frosts
0 days with 20C or more.
Total rain 176.3mm (LTA 89.1mm). 8 dry days (LTA 12), 18 days with 1mm or more (LTA 12). Wettest day 36mm on the 1st 0900 to 0900 hours next day. 5 day with >= 10mm (LTA3.5). 2 days with >= 20mm.
Total estimated sun 60 hours (LTA 84 hours).
Teignmouth Inland.
Average temp 9.4C. Air frost 1 day. Ground frost possible 5 days. Highest 15.3C on 1st (15.1 18th). Lowest -0.4C morning of 25th.
0 days with 20C or more.0 days with 25C or more.
Total rain 154.2mm. 5 (7 plus 0.25mm) dry days. 20 days, with 1mm or more, 4 days 10mm or more, 2 days 20mm or more. Wettest day 28.5mm 16th .
Digital sun 81.5 hours (correction factor 0.8) = 65.2 hours.
Bitten Park.
Average temp 9.9C. Air frost 1 day. Ground frost possible 5 days. Highest 15.6C on 18th. Lowest -0.1C morning of 25th.
0 days with 20C or more. 0 days with 25C or more.
Total rain 168.4mm. 10 dry days, 19 days, with 1mm or more, 5 days 10mm or more, 3 days 20mm or more. Wettest day 34.8 on 16th.
Netherton.
Average temp 8.9C. Air frost 3 days. Ground frost possible 7 days. Highest 15.4C on 18th. Lowest -3.9C morning of 25th.
0 days with 20C or more. 0 days with 25C or more.
Total rain *199.7mm. 8* dry days, 20* days with 1mm or more, 7 days 10mm or more, 4 days 20mm or more. Wettest day 32mm 16th. Some rain missing in last week (9mm)
Digital sun 56.5 hours (correction factor 0.0) = 56.5 hours.
The monthly weather summary is prepared as soon as possible each month and is based on unofficial recordings and the opinion of the author. No claim is made about the accuracy of the summary. If you are aware of an error or omission please e-mail mike.trigger@gmail.com (Seasonal summaries available by 10th).
The longer term averages are sourced from the Met
Office.
LTA=long term average 1981 to 2010
Weather Summary October 2023 041123
Weak weather fronts moved slowly across SW England during the first two days bringing a little rain, but soon after high pressure developed across northern France and the south of England bringing fine and quite warm weather for several days. On the 11th a cold front brought fresher NW winds for a time before low pressure moved in from the SW to bring heavy rain on the 12th and into the 13th. High pressure again developed across England bringing a few more dry days before weather fronts associated with storm Babet arrived on the 18th, producing another very wet day. The storm, initially to the west of Portugal, moved into Biscay and the English Chanel before merging into a large area of low pressure over England. This brought heavy rain, flooding and windy conditions to many parts of the UK over the next several days. Apart from a brief respite on the 22nd, rain fell on each day through to the end of the month as low pressure remained firmly in control of the weather.
In terms of statistics:
The temperature for the month averaged out between 13 and 14 Celsius, that’s between 1 and 2 degrees Celsius above the long-term average. The warmest day was the 7th when temperatures widely reached 24 or 25 Celsius. Around the district many places had 5 or 6 days when afternoon temperatures exceeded 20 Celsius. The coldest morning was on the 15th when the temperature dropped to between 2 and 5 Celsius in most parts, although Netherton dipped to zero Celsius for that one morning. The 15th and in some places the 16th may have been just cold enough for a touch of frost, although due to the recently mild weather soil temperatures are likely to be quite high.
Rainfall totals in the Teignmouth and Dawlish area were mostly in the range from 130 to 160mm, which is well above the October average of around 95mm. There were 17 days when the rainfall total was 1mm or more, the average being 12 days. There were about 12 dry days, the average being 17 days. The highest rainfall total of between 18 and 25mm was on the 12th in most parts but in some places on the 18th.
There were several windy spells including the 13th, 16th, 17th and 18th of the month.
Sunshine estimated at around 110 hours was near average for October.
The sea temperature at the Dawlish wave buoy fell from 17 Celsius at the start of the month to 15 Celsius at the end.
In summary, compared to average, October 2023 was warmer and wetter but with near average sunshine.
When shown * estimates were made using reports from nearby sites in order to calculate missing data. Grass frost estimates use air temp below 4C
Teignmouth Den. 081123 - note no sunshine data available, estimate used.
Mean temperature 13.2C (LTA 12.3C). Average Max 17.2C (LTA 15.2C). Highest 21*C on 7th. Average Min 9.3C (LTA 9.3C). Lowest 4.2C on 15th. Air frost 0. (Average 0). Potential 0 ground frosts
3 days with 20C or more. 0 days with 25C or more.
Total rain 161.9mm (LTA 94.3mm). 10 dry days (LTA 17), 16 days with 1mm or more (LTA 12). Wettest day 22mm on the 12th and 18th (0900 to 0900 hours next day). 7 day with >= 10mm. 2 days with >= 20mm.
Total sun *115* hours (LTA 101.6 hours).
Exminster.
Average temp 13.6C. Air frost 0days. Ground frost possible 1 days. Highest 26.9C on 7th. Lowest 2.1C morning of 15th.
15 days with 20C or more. 4 days with 25C or more.
Total rain 122mm. 10 dry days, 18 days, with 1mm or more, 5 days 10mm or more, 0 days 20mm or more. Wettest day 15mm 12th.
Dawlish inland.
Average temp 13.6C. Air frost 0 days. Ground frost possible 1 days. Highest 25.3C on 7th. Lowest 2.8C morning of 15th.
5 days with 20C or more. 1 day with 25C or more.
Total rain 150mm. 12 dry days, 17 days with 1mm or more, 6 days 10mm or more, 1 days 20mm or more. Wettest day 19.5mm 12th 20.6mm 18th.
Digital sun 110 hours (correction factor 0.0) = 110 hours.
Teignmouth Inland.
Average temp 13.8C. Air frost 0days. Ground frost possible 1 days. Highest 23.4C on 7th. Lowest 3.9C morning of 15th.
3 days with 20C or more. 0 days with 25C or more.
Total rain 145mm. 10 dry days, 18 days, with 1mm or more, 7 days 10mm or more, 0 days 20mm or more. Wettest day 19mm 12th and 18th .
Digital sun 115 hours (correction factor 0.0) = 115 hours.
Bitten Park.
Average temp 14.2C. Air frost 0days. Ground frost possible 0 days. Highest 24.4C on 7th. Lowest 4.5C morning of 15th.
8 days with 20C or more. 0 days with 25C or more.
Total rain 166mm. 12 dry days, 17 days, with 1mm or more, 8 days 10mm or more, 0 days 20mm or more. Wettest day 18.4mm 12th and 19.2mm 18th .
Netherton.
Average temp 13.1C. Air frost 1day. Ground frost possible 2 days. Highest 24.5C on 7th. Lowest 0C morning of 15th.
5 days with 20C or more. 0 days with 25C or more.
Total rain 167mm. 10 dry days, 17 days with 1mm or more, 9 days 10mm or more, 1 days 20mm or more. Wettest day 19.6mm 12h 25.6mm 18th.
Digital sun 130 hours (correction factor 0.9) = 117 hours.
Weather Summary September 2023 011023
After a little rain on the 1st, high pressure moved across SW England bringing six days of very warm and sunny weather. Following a hot day on the 9th, thundery showers moved north from Biscay overnight, clearing to allow a return to fine and rather warm weather through to mid-month. On the 16th and 17th a series of troughs moved north from France. The troughs brought thunderstorms with heavy or violent rain across the district causing quite widespread flooding. Rain rates through the middle of the 17th reached 35mm per hour across Dawlish and Teignmouth but over the hills around Dawlish Water and towards Kenton, rain rates reached 70mm per hour. (The Met Office defines the rain rate for a violent shower as being above 50mm per hour). Much of the remainder of the month was unsettled and at times windy as Atlantic weather systems spread from the west. On the 27th storm Agnes, which contained the remains of tropical storm Margot, moved across southern Ireland and on the 28th moved across southern Scotland. The storm brought some rain across the district but associated strong wind and gales remained further north. The month ended with high pressure developing over southern England.
A chart sequence for September 2023 can be viewed here
In terms of statistics:
The temperature for the month averaged out a little over 17 Celsius, that’s over 2 degrees above the long-term average. The warmest day was the 9th when temperatures widely reached 25 to 28 Celsius with a few sheltered gardens reporting around 30 Celsius. Around the district many places had 16 to 20 days when afternoon temperatures exceeded 20 Celsius and between 1 and about 8 days when 25 Celsius was reached. The coldest morning was on the 23rd when the temperature dropped to around 7 or 8 Celsius, although Netherton dipped to almost 3 Celsius for that one morning.
Rainfall totals in the Teignmouth and Dawlish area ranged from 70mm to 90mm, well above the average of around 60mm. Near Netherton and along the Dawlish Water catchment as well as over the hills near Kenton, rainfall totals reached 120 to 150mm over half of which fell on the 17th which of course was the wettest day on the month. Despite above average rainfall there were 8 to 10 days with 1mm or more of rain which is close to the average and the number of dry days (around 15) was only slightly below the average.
There were several windy spells including the 19/20th 24th and 27th.
Sunshine estimated at around 150 hours was a little below the average of 160 hours.
The sea temperature at the Dawlish wave buoy rose to over 20 Celsius during the very warm spell earlier in the month falling back to 17 Celsius after the 22nd.
In summary, Compared to average, September 2023 was much warmer, had higher rainfall amounts and lower sunshine hours.
When shown * estimates were made using reports from nearby sites in order to calculate missing data. Grass frost estimates use air temp below 4C
Teignmouth Den* some missing. NO SUNSHINE DATA due roof problem
Mean temperature 17C (LTA 15.2C). Average Max 20.8C (LTA 18.6) Highest 24.6C on 9th. Average Min 13.29C (LTA 11.7C). Lowest 7.5C on 23rd. Air frost 0. (Average 0).
17days with 20C or more. 0 days with 25C or more.
Total rain 83.9mm (LTA 57.5mm). 17 dry days(LTA 17), 9 days with 1mm or more (LTA 9). Wettest day 23.4mm on the 17th 0900 to 0900 hours next day. 4 days with >= 10mm (LTA 2). 1 days with >= 20mm.
Total sun estimate 154.6 (Tiger) hours (LTA 160.7 hours).
Dawlish inland.
Average temp 17.2C. Air frost 0 days. Ground frost possible 0 days. Highest 28C on 9th. Lowest 6.8C morning of 23rd.
18 days with 20C or more. 7 days with 25C or more.
Total rain 95mm. 15 dry days, 10 days with 1mm or more, 2 days 10mm or more, 1 days 20mm or more. Wettest day 35.3mm 17th .
Digital sun 188.7 hours (correction factor 0.8) = 151 hours.
Teignmouth Inland.
Average temp 17.4C. Air frost 0days. Ground frost possible 0 days. Highest 25.5C on 9th. Lowest 8C morning of 23rd.
17 days with 20C or more. 1 days with 25C or more.
Total rain 85mm . 13 dry days. 10 days, with 1mm or more, 3 days 10mm or more, 1 days 20mm or more. Wettest day 30mm 17th .
Digital sun 155 hours (correction factor 0.0) = 155 hours.
Netherton.
Average temp 16.5C. Air frost 0days. Ground frost possible 0 days. Highest 27.4C on 9th. Lowest 3.4C morning of 23rd.
17 days with 20C or more. 5 days with 25C or more.
Total rain 123mm. 12 dry days, 11 days with 1mm or more, 3 days 10mm or more, 1 days 20mm or more. Wettest day 51.8mm 17th .
Digital sun 197 hours (correction factor 0.8) = 158 hours.
Weather Summary SUMMER 2023 020923
Above average temperatures but higher rainfall totals due to more days with rain and heavier rain despite slightly above average enumber of dry days. Below average sunshine. Very warm and dry June offset by wet and slightly cool July and average or slightly wetter August.
In terms of statistics: Notice how higher average temperatures and rainfall in the 1991-2010 period have the affect of reducing the anomalies when compared to the 1961-1990 30 year period. Continuing warming of the climate should mean that anomalies later in the 2020's should be higher.
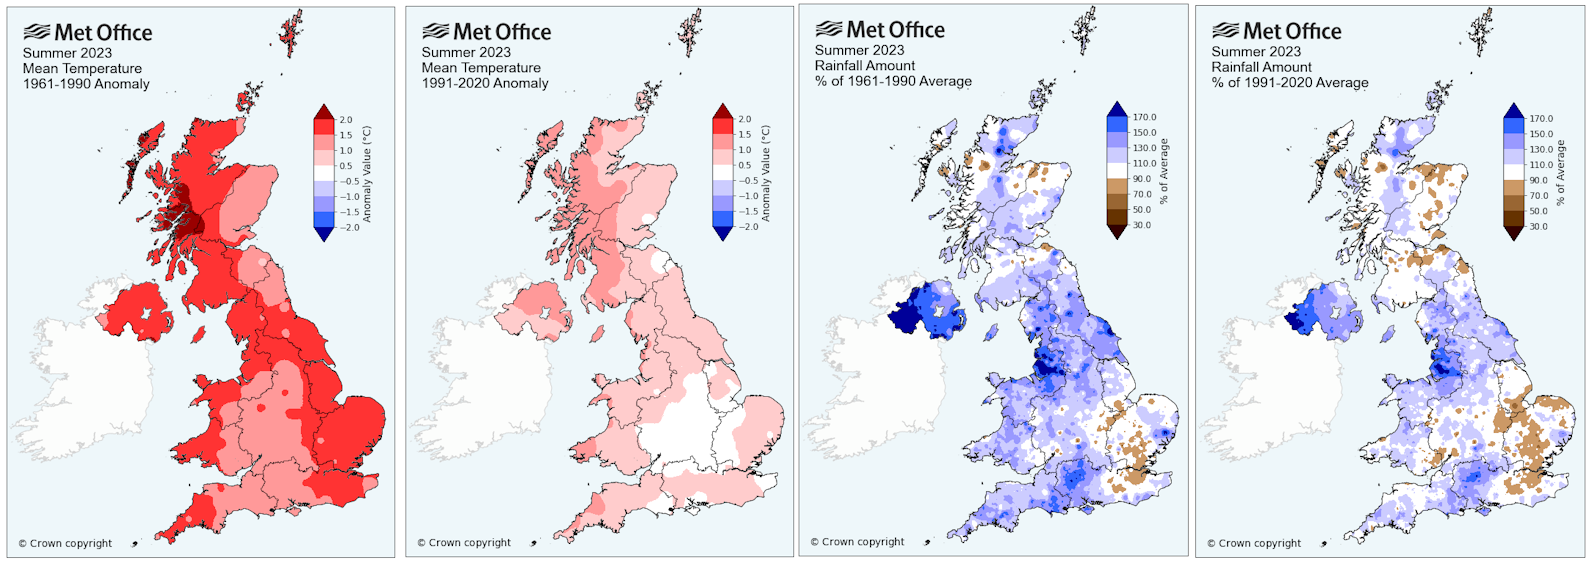
When shown * estimates were made using reports from nearby sites in order to calculate missing data.
Teignmouth Den*.
Mean temperature 17.3C (LTA 16.5C). Average Max 21.2C (LTA 20.1C). Average Min 13.5C (LTA 13C).
70 days with 20C or more. 4 days with 25C or more.
Total rain 203.2mm (LTA 150.1mm). 53 dry days (LTA 51), 28 days with 1mm or more (LTA 23). 6 day with >= 10mm (LTA 4.5). 1 days with >= 20mm.
Total sun 640 hours (LTA 657 hours).
Dawlish inland.
Average temp 17.1C.
68 days with 20C or more. 9 days with 25C or more.
Total rain 193.7mm. 56 dry days, 29 days with 1mm or more, 5 days 10mm or more, 1 days 20mm or more.
Digital sun (correction factor 0.8) = 510.5 hours.
Netherton.
Average temp 16.7C.
70 days with 20C or more. 8 days with 25C or more.
Total rain 201.4mm. 56 dry days, 30 days with 1mm or more, 6 days 10mm or more, 1 days 20mm or more.
Digital sun (correction factor 0.8) = 692 hours (looks high).
Weather Summary August 2023 010923
August started wet and unsettled as an unusually deep low pressure centre moved from southern Ireland across the south of England. There was a brief respite on the 4th before storm Antoni brought further gales across SW England as the low tracked east towards Belgium on the 5th. Pressure then rose to bring a mostly dry period between the 6th and 12th, although weak weather systems did produce some light and patchy rain during this time more especially elsewhere in SW England. The main low pressure centre remained close to the NW of the UK but on the 13th and 14th, weather fronts associated with low pressure moving up the Bristol Channel, brought some rain across the district. Higher pressure brought two more spells of mainly dry weather between the 15th and 17th also the 19th to 23rd. During the 18th, however, storm Betty moved over southern Ireland bringing gales and rain across SW England. Temperatures reached the mid-twenties Celsius ahead of this storm on the 16th but the highest temperature for the month in many areas was associated with warm air from France on the 22nd ahead of showery outbreaks of rain on the 24th to 27th. After another brief mainly dry few days, the month ended with a very dull, wet and humid day on the 31st as Atlantic weather fronts swept east over SW England.
In terms of statistics:
The temperature for the month averaged out around 17 Celsius, which is close to the long-term average. The warmest day was the 22nd and in some places also the 16th when temperatures widely reached 25 or 26 Celsius. Around the district most places had at least 20 days when afternoon temperatures exceeded 20 Celsius. The coldest morning was on the 7th but in places also the 25th when the temperature dropped to between 9 and 11 Celsius.
Rainfall totals in the Teignmouth and Dawlish area ranged from 55mm to 75mm, which was a little above average for August. Despite above average rain totals the number of dry days was between 16 and 20 days which is about right for August. There were around 11 days with 1mm or more of rain and one or two days with 10mm or more. The wettest day was the 31st when between 13 and 19mm of rain was recorded across the district.
There were several windy spells including the 2nd/3rd 5th and 18th/19th.
Sunshine of around 190 hours was a little below the average of 210 hours.
The sea temperature at the Dawlish wave buoy was around 17 or 18 Celsius.
A chart sequence for August 2023 can be viewed here
In summary, August 2023 had above average total rainfall but a near average number of dry days. Temperatures were also near average although there was slightly less sunshine.
When shown * estimates were made using reports from nearby sites in order to calculate missing data. Grass frost estimates use air temp below 4C
Teignmouth Den*.
Mean temperature 17.5C (LTA 17.2C). Average Max 20.8C (LTA 20.7C). Highest 24.9C on 22nd. Average Min 14.1C (LTA 13.7C). Lowest 11.5C on 7th 25th.
22 days with 20C or more. 0 days with 25C or more.
Total rain 74.7mm (LTA 54.1mm). 16 dry days, 12 days with 1mm or more (LTA 8). Wettest day 15.9mm on the 31st July 0900 to 0900 hours next day, or 14mm recorded 31st. 3 days with >= 10mm. 0 days with >= 20mm.
Total sun 182.5 hours (LTA 209.6 hours).
Dawlish inland.
Average temp 16.9C. Highest 26C on 16th 22nd. Lowest 9C morning of 7th.
20 days with 20C or more. 2 days with 25C or more.
Total rain 71mm. 18 dry days, 12 days with 1mm or more, 1 day 10mm or more, 0 days 20mm or more. Wettest day 18.5mm 31st .
Digital sun 237 hours (correction factor 0.8) = 190 hours.
Teignmouth Inland.
Average temp 17C. Highest 25.7C on 22nd. Lowest 10.9C morning of 7th 25th.
24days with 20C or more. 1 day with 25C or more.
Total rain 73mm. 12 dry days 10 days, with 1mm or more, 2 days 10mm or more, 0 days 20mm or more. Wettest day 17.5mm 31st .
Digital sun 193 hours (correction factor 0.9) = 174 hours.
Netherton.
Average temp 16.5C. Highest 25.6C on 16th. Lowest 6.9C morning of 25th
24 days with 20C or more. 1 day with 25C or more.
Total rain 73.6mm. 16 dry days, 11 days with 1mm or more, 2 days 10mm or more, 0 days 20mm or more. Wettest day 15mm 31st .
Digital sun 257 hours (correction factor 0.7) = 180 hours.
Weather Summary July 2023 01AUG2023
Weather patterns during July were dominated by a series of Atlantic low pressure centres moving across the UK bringing very changeable conditions. At the start of the month WNW winds brought showers to parts of SW England but on the 4th a small low pressure centre moved through the channel producing a period of heavy rain across the district. The briefest of ridges on the 5th and 6th was swept away as a low developed to the W of Scotland by the 7th with a further quite deep low just SW of Ireland on the 8th. Ahead of these low pressure centres, winds turned more southerly and this lifted temperatures a little. Despite a rise in pressure, weather fronts brought spells of wet weather which culminated in another period of heavy rain on the 10th. This was followed by showery intervals before a deepening low pressure centre moved into the Irish Sea and brought some extremely wet weather across the district on the 14th. Showery weather and W to NW winds followed but subsequently a build of pressure brought the driest and warmest period of the month between the 17th and 21st. The 22nd was fairly wet and cool for most parts as a further Atlantic low pressure moved across the UK, then to be followed by further lows and a changeable weather pattern through to the end of the month.
In terms of statistics:
The temperature for the month averaged out between 16 and 17 Celsius, about half a degree below the thirty-year average. The warmest day was the 19th when temperatures widely reached 24 Celsius and in one or two spots managed to climb just above 25 Celsius. Around the district most places had at least 20 days when afternoon temperatures exceeded 20 Celsius. The coldest morning was on the 26th when the temperature dropped to between 5 and 9 Celsius.
Rainfall totals in the Teignmouth and Dawlish area ranged from 80mm to 120mm, more than double the average rainfall for July. There were 8 to 15 days with 1mm or more of rain which compares to the average of 7 days but there were about 10 to 15 days with no significant rain which is close to the average number. There were three days with 10mm or more recorded (4th 10th and 22nd) but the wettest day was the 14th when between 30 and 40mm of rain was recorded across the district.
There were several windy spells including the 15th 22nd and 27th.
Sunshine of around 170 to 200 hours was 10% below the average.
The sea temperature at the Dawlish wave buoy fell back to 15 Celsius at the start of the month, probably due to cooler NW winds, but rose irregularly to between 16 and 17 Celsius after the first week of July.
In summary, July 2023 was a lot wetter but only slightly cloudier and slightly cooler than average.
When shown * estimates were made using reports from nearby sites in order to calculate missing data. Grass frost estimates use air temp below 4C
Teignmouth Den.
Mean temperature 16.9C (LTA 17.3C). Average Max 20.7C (LTA 20.8C). Highest 23.9C on 19th. Average Min 13.2C (LTA 13.7C). Lowest 9.2C on 26thst. Air frost 0. (Average 0). Potential 0 ground frosts
23 days with 20C or more. 0 days with 25C or more.
Total rain 109mm (LTA 45.5mm).13 dry days (LTA 14), 12 days with 1mm or more (LTA 7). Wettest day 34.5m on the 14th 0900 to 0900 hours next day. 3 days with >= 10mm. 1 day with >= 20mm.
Total sun 173 hours (LTA 225 hours).
Dawlish inland.
Average temp 16.5C. Air frost 0 days. Ground frost possible 0 days. Highest 24.5C on 19th. Lowest 7C morning of 26th.
22 days with 20C or more. 0 days with 25C or more.
Total rain 100mm. 15 dry days, 12 days with 1mm or more, 3 days 10mm or more, 1 days 20mm or more. Wettest day 37mm 14th .
Digital sun 260 hours (correction factor 0.8) = 208 hours.
Teignmouth Inland.
Average temp 17.1C. Air frost 0days. Ground frost possible 0 days. Highest 24C on 19th. Lowest 9.3C morning of 26th.
23 days with 20C or more. 0 days with 25C or more.
Total rain 108mm. 9 dry days 11 days, with 1mm or more, 3 days 10mm or more, 1 days 20mm or more. Wettest day 37mm 14th .
Digital sun 195hours (correction factor 0.9) = 175 hours.
Netherton.
Average temp 16.4C. Air frost 0days. Ground frost possible 0 days. Highest 24C on 19th. Lowest 5.2C morning of 26th.
20 days with 20C or more. 0 days with 25C or more.
Total rain 112mm. 15 dry days, 14 days with 1mm or more, 4 days 10mm or more, 1 days 20mm or more. Wettest day 39.2mm 14th .
Digital sun 280 hours (correction factor 0.7) = 224 hours.
Weather Summary June 2023 020723
High pressure to the north and low pressure to the south resulted in winds predominantly from an easterly point for the first twenty days of June. By the 9th, low pressure had edged closer to SW England and the high pressure had moved slightly away towards Scandinavia. This fall in pressure allowed showery outbreaks of rain to reach the district on the 9th and 10th. Pressure recovered a little before a similar process brought a little more rain on the 16th and 17th. Low pressure then remained over or just west of the UK eventually bringing a band of thundery rain north across Biscay and over SW England for the 20th. This started a change which resulted in pressure falling across the north of the country as higher pressure developed to the south. The results were winds mostly from between west and south and the passage of weak Atlantic weather systems across SW England which led to slightly cooler temperatures after the heat of mid-month.
In terms of statistics:
The temperature for the month averaged out near 18 Celsius, that’s almost three degrees above the longer-term average (LTA 1980-2010). The warmest day was the 13th when temperatures reached 26 or 27 Celsius at the coast and around 30 Celsius inland. Around the district most places had at least 25 days when afternoon temperature exceeded 20 Celsius, a few urban locations only had one day when 20 Celsius was not reached. There was between 4 and 11 days when the temperature reached 25 Celsius and a few urban parts reached 30 Celsius on one or two days around the 13th. The coldest morning was on the 3rd when the temperature dropped to 8 or 9 Celsius, although a few inland areas dipped to 5 Celsius.
Rainfall totals in the Teignmouth and Dawlish area ranged from 16mm to 26mm, less than half the average June rainfall. There were around 24 dry days (average 19 days), 4 days with 1mm or more of rain (average 8) and in some places 1 day with 10mm or more of rain (a typical number for June). The wettest day of the month was the 20th when between 6 and 15mm of rain fell.
Sunshine estimates suggest around 284 hours of sunshine that’s almost 30% more sunshine than average.
The sea temperature at the Dawlish wave buoy increased from 15 Celsius, at the start of the month, to be around 16 Celsius at the end. The sea temperature, however, reached close to 20 Celsius during the hot weather in the middle of the month, which was unusually warm.
In summary, June 2023 drier, warmer and sunnier than average.
When shown * estimates were made using reports from nearby sites in order to calculate missing data. Grass frost estimates use air temp below 4C
Teignmouth Den.
Mean temperature *17.6C (LTA 15.1C). Average Max *22C (LTA 19C). Highest 26.4C on 13th. Average Min *13.2C (LTA 11.6C). Lowest 9C on 3rd.
25 days with 20C or more. 4 days with 25C or more.
Total rain 19.4mm (LTA 50.5mm). 24 dry days(LTA 19), 4 days with 1mm or more (LTA 8). Wettest day 9m on the 20th 0900 to 0900 hours next day. 0 day with >= 10mm (LTA 1). 0 days with >= 20mm.
Total sun 284.5* hours (LTA 222.4 hours).
Dawlish inland.
Average temp 18C. Highest 30C on 13th. Lowest 8.3C morning of 3rd.
26days with 20C or more. 7 days with 25C or more.
Total rain 22.7mm. 23 dry days. 5 days, with 1mm or more, 1 days 10mm or more, 0 days 20mm or more. Wettest day 13mm 20th .
Digital sun 315.2 hours (correction factor 0.9) = 283.5 hours.
Teignmouth Inland.
Average temp 18C. Highest 27.9C on 13th. Lowest 9.8C morning of 3rd.
25 days with 20C or more. 4 days with 25C or more.
Total rain 18mm. 22 dry days, 5 days with 1mm or more, 0 days 10mm or more, 0 days 20mm or more. Wettest day 8.1mm 20th.
Netherton.
Average temp 17.1C. Highest 29.6C on 13th. Lowest 5.2C morning of 7th.
26 days with 20C or more. 7 days with 25C or more.
Total rain 15.8mm. 25 dry days, 5 days with 1mm or more, 0 days 10mm or more, 0 days 20mm or more. Wettest day 6.1mm 20th .
Digital sun 320.7 hours (correction factor 0.9) = 288.6 hours.
Weather Summary Spring 2023 MAM updated 5 Jun2023
Summary - Temperature above average overall. Much wetter than average based on rain total but only about 8 fewer dry days but number of days 10mm or more at least double. Sunshine near average.
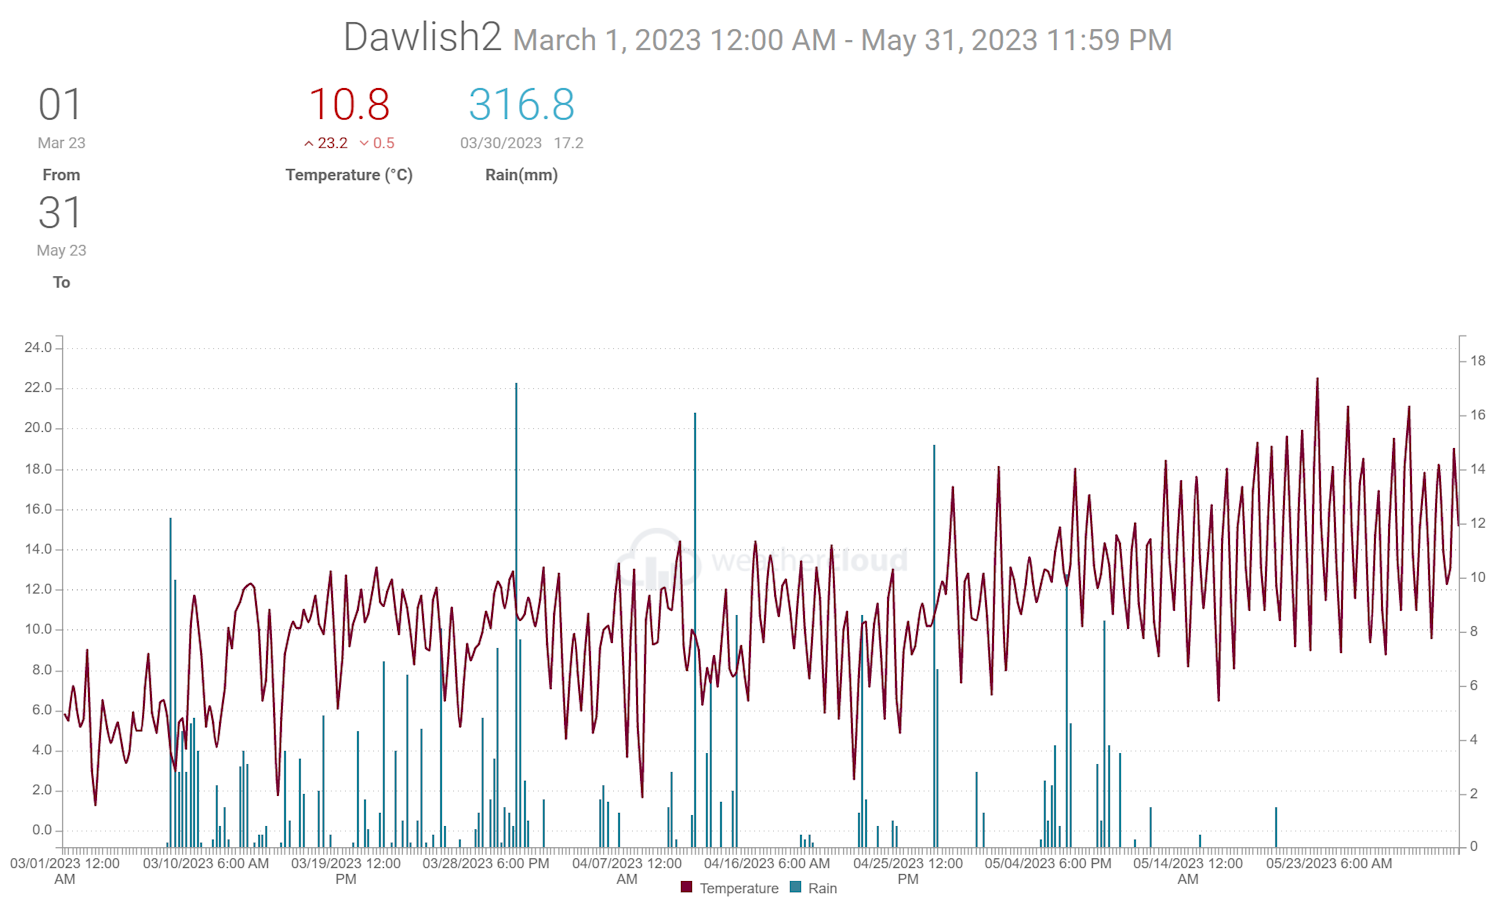
When shown * estimates were made using reports from nearby sites in order to calculate missing data. Grass frost estimates use air temp below 4C
Teignmouth Den*.
Mean temperature *10.8*C (LTA 9.9). Average Max *14.2C (LTA 13.1C). Average Min *7.3C (LTA 9.9 C). Air frost 0. (Average 1). Potential 0 ground frosts
Total rain *342mm (LTA 186.6m). 43* dry days (LTA 50), *43 days with 1mm or more (LTA 30). 12* day with >= 10mm (LTA 5.5). 2* days with >= 20mm.
Total sun *543.5 hours (LTA 526 hours).
Dawlish inland.
Average temp 10.8C. Air frost 0days. Ground frost possible 15 days. Total rain 310mm. 43 dry days, 41 days with 1mm or more, 10 days 10mm or more. 2days 20mm or more. Digital sun 636 hours (corrected 489).
Teignmouth inland.
Average temp 10.9C. Air frost 0days. Ground frost possible 6 days. Total rain 346mm. 42 dry days, 40 days with 1mm or more, 14 days 10mm or more. 2 days 20mm or more. Digital sun 566 hours, corrected 484.
Netherton.
Average temp 10.2C. Air frost 7days. Ground frost possible 28 days. Total rain 345mm. 42 dry days, 40 days with 1mm or more, 13 days 10mm or more, 3 days 20mm or more.
Digital sun 617 hours corrected 484.
Weather Summary May 2023 01Jun2023
May started dry as high pressure built over the UK. This did not last as outbreaks of rain and lower pressure, associated with a series of Atlantic weather systems, moved across the country to produce an unsettled spell between the 4th and 11th. By the 12th high pressure had again developed over the country and this brought largely dry weather across SW England for the remainder of May. Weakening cold fronts moving through the high did however produce some showery rain on the 14th and 19th. Winds were often from the east or northeast except during the unsettled period when south-westerly winds prevailed. The easterly winds were often quite chilly despite plenty of sunshine.
In terms of statistics:
The temperature for the month averaged out near 14 Celsius, that’s a degree above the longer-term average (LTA 1980-2010). The warmest day was the 22nd and in a few places the 28th when temperatures reached between 22 and 26 Celsius. The coldest morning was on the 16th in most places when the temperature dropped to between 5 and 8 Celsius, although a few inland areas were slightly colder. Netherton, in a northern sloping valley, dipped to 3 Celsius which may have been cold enough for a touch of ground frost, although most of the district was frost free.
Rainfall totals in the Teignmouth and Dawlish area ranged from 40mm to 50mm which is a little below the average rainfall for May. There were 22 dry days (average 18 days), 6 or 7 days with 1mm or more of rain (average 9) and 1 or 2 days with 10mm or more of rain (a typical number for May). The wettest day of the month was the 8th with between 15 and 20mm of rain.
Sunshine estimates suggest around 240-290 hours of sunshine that’s 40% more sunshine than average.
The sea temperature at the Dawlish wave buoy increased from 12 Celsius at the start of May to 15 Celsius at the end.
In summary May 2023: drier, warmer and sunnier than average.
When shown * estimates were made using reports from nearby sites in order to calculate missing data. Grass frost estimates use air temp below 4C
Teignmouth Den. added 5th June
Mean temperature *14C (LTA 12.9C). Average Max *18.1C (LTA 15.7C). Highest 22.8C on 22nd. Average Min *9.9C (LTA 9C). Lowest 7.6C on 16th. Air frost 0. (Average 0). Potential 0 ground frosts
3 days with 20C or more. 0 days with 25C or more.
Total rain 53.5mm (LTA 59mm). 24* dry days (LTA 18), 6 days with 1mm or more (LTA 9). Wettest day 18.4mm on the 5th 0900 to 0900 hours next day. 2 days with >= 10mm (LTA 1 or 2). 0 days with >= 20mm.
Total sun 286.7* hours (LTA 217.5 hours).
Dawlish inland.
Average temp 14C. Air frost 0days. Ground frost possible 0 days. Highest 24C on 22nd. Lowest 5C morning of 16th.
19 days with 20C or more. 0 days with 25C or more.
Total rain 50mm. 22 dry days, 7 days with 1mm or more, 2 days 10mm or more. 0 days 20mm or more. Wettest day 18mm 8th .
Digital sun 299* hours (correction factor 0.8) = 240 hours.
Teignmouth Inland.
Average temp 14.2C. Air frost 0days. Ground frost possible 0days. Highest 22.8C on 22nd. Lowest 7C morning of 16th.
5 days with 20C or more. 0 days with 25C or more.
Total rain 45mm. 21 dry days, 6 days with 1mm or more, 2 days 10mm or more, 0 days 20mm or more. Wettest day 16.2mm 8th .
Digital sun 220 hours (correction factor 1) = 220 hours.
Netherton.
Average temp 13.1C. Air frost 0days. Ground frost possible 1 day. Highest 22.8C on 22 and 28th. Lowest 2.6C morning of 16th.
10 days with 20C or more. 0 days with 25C or more.
Total rain 48mm. 21 dry days. 6 days with 1mm or more, 2 days 10mm or more, 0 days 20mm or more. Wettest day 17.7mm 8th.
Digital sun 310 hours (correction factor 0.8) = 248 hours.
Other data.
Location in Exminster recored 22 days over 20C and one day over 25C (27C), Lower Netherton 18 days with 20C and 2 days 25C (25.6C), some coastal areas only 3 or 4 days with 20C or more.
Weather Summary April 2023 2023 1st May 2023
Low pressure quickly moved away eastwards at the start of the month as high pressure developed from the west bringing the suggestion of some drier weather after the very wet March. This was however a short lived drier spell between the 2nd and 8th interrupted by Atlantic weather fronts on the 5th and 6th. Rain again spread from the west later on the 9th heralding an unsettled wet and at times windy spell between the 11th and 14th.
During this period storm Noa, named by Meteo France, developed quickly as it moved towards Wales, late on the 11th, before lingering as a filling depression over northern parts of the UK until the 13th. The storm was unusually severe for April bringing gales to many parts of the SW, wind gustd exceeded 50 to 60mph and approached 70mph at Berry Head. According to the Met Office a new record for April was set at The Needles Old Battery (a very exposed location) where gusts reached 96mph, this exceeded the 90mph set at Avonmouth in April 1994.
Between the 15th and 21st there was another mostly dry period, associated with higher pressure, before a trough of low pressure moved from the East merging with a new low from Biscay to bring some fairly heavy rain across the district on the 22nd. There were a few more dry days before the end of the month but on the 27th Atlantic low pressure moved across the district producing the wettest day of the month.
A chart sequence for April 2023 can be viewed here
In terms of statistics:
The temperature for the month averaged out at near or slightly above the 30 year long term average (LTA 1980-2010) at around 10 Celsius. The warmest day was the 28th when temperatures reached between 18 and 20 Celsius in most places. The coldest morning was the 7th or 8th when the temperature dropped to between 1 and 3 Celsius, although a few inland areas were slightly colder, and Netherton dipped as low as minus 1 Celsius. Spare a thought for areas near Exeter Airport where there were ten nights with an air frost this April. Typically coastal areas like Teignmouth only have an air frost in April once in three or four years.
Rainfall totals in the Teignmouth and Dawlish area ranged from 80mm to just over 100mm which compares to the average value of 60mm. There were around 14 dry days (average 17 days), and about 14 days with 1mm or more of rain (average 10). Typically there are 1 or 2 days with 10mm of rain or more during April but this year there were 3 or 4 days and on the 27th, the wettest day of the month, most places had around 20mm of rain.
There were windy periods on several days including the 10th, 12th and 14th.
Sunshine was between 160 and 180 hours, that’s a little below the average of 186 hours.
The sea temperature at the Dawlish wave buoy increased from 10 Celsius at the start of April to 13 Celsius at the end.
In summary, April 2023 was cloudier and wetter than average with near or fractionally above average temperature.
When shown * estimates were made using reports from nearby sites in order to calculate missing data. Grass frost estimates use air temp below 4C
Teignmouth Den*.
Mean temperature *9.8C (LTA 9.5C). Average Max *13.2C (LTA 12.8C). Highest 17.9C on 28th. Average Min *6.3C (LTA 6.1C). Lowest 2.7C on 8th. Air frost 0. (Average 1 every 3 or 4 years). Potential 2 ground frosts
Total rain *108.9mm (LTA 58.4mm). 13 dry days, 15 days with 1mm or more (LTA 10). Wettest day 22mm on the 27th 0900 to 0900 hours next day. 3 days with >= 10mm. 1 day with >= 20mm.
Total sun 170.8* hours (LTA 186.3 hours).
Dawlish inland.
Average temp 9.7C. Air frost 0 days. Ground frost possible 7 days. Highest 19C on 28th. Lowest 1.3C morning of 8th/22nd. Total rain 97mm. 14 dry days, 14 days with 1mm or more, 4 days 10mm or more. 1 day 20mm or more. Wettest day 21.4mm 27th.
Digital sun 210 hours (correction factor 0.8) = 168 hours.
Teignmouth Inland.
Average temp 10.2C. Air frost 0days. Ground frost possible 1 days. Highest 18.4C on 28th. Lowest 3C morning of 8th. Total rain 105mm. 14 dry days. 12 days, with 1mm or more, 4 days 10mm or more, 1 days 20mm or more. Wettest day 20.5mm 27th .
Digital sun 172 hours (correction factor 0.8) = 137 hours.
Netherton.
Average temp 9.3C. Air frost 1days. Ground frost possible 14 days. Highest 18.4C on 28th. Lowest -1C morning of 8th. Total rain 105mm. 14 dry days, 12 days with 1mm or more, 5 days 10mm or more, 0 days 20mm or more. Wettest day 18.8mm 11th .
Digital sun 229hours (correction factor 0.8) = 183 hours.
Weather Summary March 2023 1st April 2023
High pressure over Britain brought largely dry but rather chilly weather across the district for the first week, and was very much a continuation of the exceptionally dry weather in February. From the 8th it was all change as Atlantic weather systems swept across southern England. These first weather systems brought over half a month’s rain in just two days as low pressure tracked east over SW England. After a brief lull on the 10th, further Atlantic depressions moved towards the UK bringing milder temperatures associated with frequent southwest winds, rather cloudy skies and periods of rain. There was a little respite on the 19th and 26th as temporary ridges of higher pressure produced a few drier days. The month ended with storm Mathis (named by MeteoFrance) moving east over southern England and producing another wet period.
In terms of statistics:
Despite a cold start to the month the average temperature was between 8 and 9 Celsius, almost a degree above the 1961 to 2010 long term average for March. The highest temperature of the month was between 15 and 16 Celsius and occurred in different parts of the district between the 18th and 25th. The coldest night occurred on the 3rd of the month in all parts when lowest values ranged from just above freezing in most places to as low as minus 1.3 Celsius in Exminster and minus 3 Celsius in Netherton. Most parts avoided an air frost although temperatures in the early part of the month were low enough for a possible ground frost. Exminster only had one air frost, but Nertherton, which is in a valley that slopes down towards the North, recorded an air frost on six nights.
Rainfall total in the Dawlish area ranged from 120 to 160mm but near the Teign estuary across to Exeter values of 150 to almost 200mm where recorded. This was about two and in places three times the average rainfall expected in March and goes some way to making up for the very dry February. There were around 8 dry days (average 15), 20 days with 1mm or more of rain (average 11), between 4 and 7 days with 10mm or more (average 2 or 3 days) and 1 or 2 days with 20mm or more.
There were windy periods on several days including the 9th 10th 13th 22nd 23rd 25th and 31st.
Sunshine was estimated to be between 50 and 90 hours, that’s half to two thirds of the long term average of 123 hours.
The sea temperature at the Dawlish wave buoy increased from 8 Celsius at the start of March to 10 Celsius at the end.
In summary, March 2023 after a dry but chilly first week the month became very wet and mild.
A chart sequence for March 2023 can be viewed here
When shown * estimates were made using reports from nearby sites in order to calculate missing data. Grass frost estimates use air temp below 4C
Teignmouth Den. added 10th April - rain adjusted 1May2023 based on aggrgate total 30/31st March and 1st April
Mean temperature 8.6C (LTA 7.9C). Average Max 11.4C (LTA 10.9C). Highest 14.3C on 21st. Average Min 5.8C (LTA 4.9C). Lowest 1.9C on 3rd. Air frost 0. (Average 1). Potential 8 ground frosts
Total rain *173.7mm (LTA 69.4mm). 6 dry days (LTA 15), 22 days with 1mm or more (LTA 11). Wettest day 24mm on the 8th 0900 to 0900 hours next day. 7 days with >= 10mm (LTA 2 to 3 days). 1 day with >= 20mm.
Total sun *86.2 hours (LTA 123 hours).
Dawlish inland.
Average temp 8.4C. `Air frost 0 days. Ground frost possible 8 days. Highest 15.6C on 18th. Lowest 0.5C morning of 3rd. Total rain 163mm. 7 dry days, 20 days with 1mm or more, 5 days 10mm or more. 1 days 20mm or more. Wettest day 29mm 8th.
Digital sun 117 hours (correction factor 0.7) = 81 hours.
Dawlish Coastal.
Average temp 8.8C. Air frost 0 days. Ground frost possible 4 days. Highest 15.9C on 25th. Lowest 0.8C morning of 3rd. Total rain 142mm. 7 dry days, 21 days with 1mm or more, 4 days 10mm or more. 1 days 20mm or more. Wettest day 26mm 8th.
Teignmouth Bitten.
Average temp 9.1C. Air frost 0 days. Ground frost possible 7 days. Highest 15C on 18th. Lowest 1.9C morning of 3rd. Total rain 155mm. 8 dry days, 18 days with 1mm or more, 6 days 10mm or more, 1 days 20mm or more. Wettest day 27mm 8th.
Teignmouth Inland.
Average temp 8.8C. Air frost 0days. Ground frost possible 6 days. Highest 15.7C on 25th. Lowest 2.2C morning of 3rd. Total rain 196mm. 7 dry days, 22 days with 1mm or more, 7 days 10mm or more, 2 days 20mm or more. Wettest day 35mm 8th.
Digital sun 117 hours (correction factor 0.7) = 81 hours.
Netherton.
Average temp 8.4C. Air frost 6 days. Ground frost possible 13 days. Highest 15.1C on 18th. Lowest -3.1C morning of 3rd. Total rain 192mm. 7 dry days, 22 days with 1mm or more, 7 days 10mm or more, 2 days 20mm or more. Wettest day 35mm 8th.
Digital sun 135 hours (correction factor 0.7) = 94 hours.
Weather Summary Winter 2022/2023 DJF 3 March 2023
Summary - Temperature near average overall. Wetter than average despite almost dry February 2023 and start of December 2022.
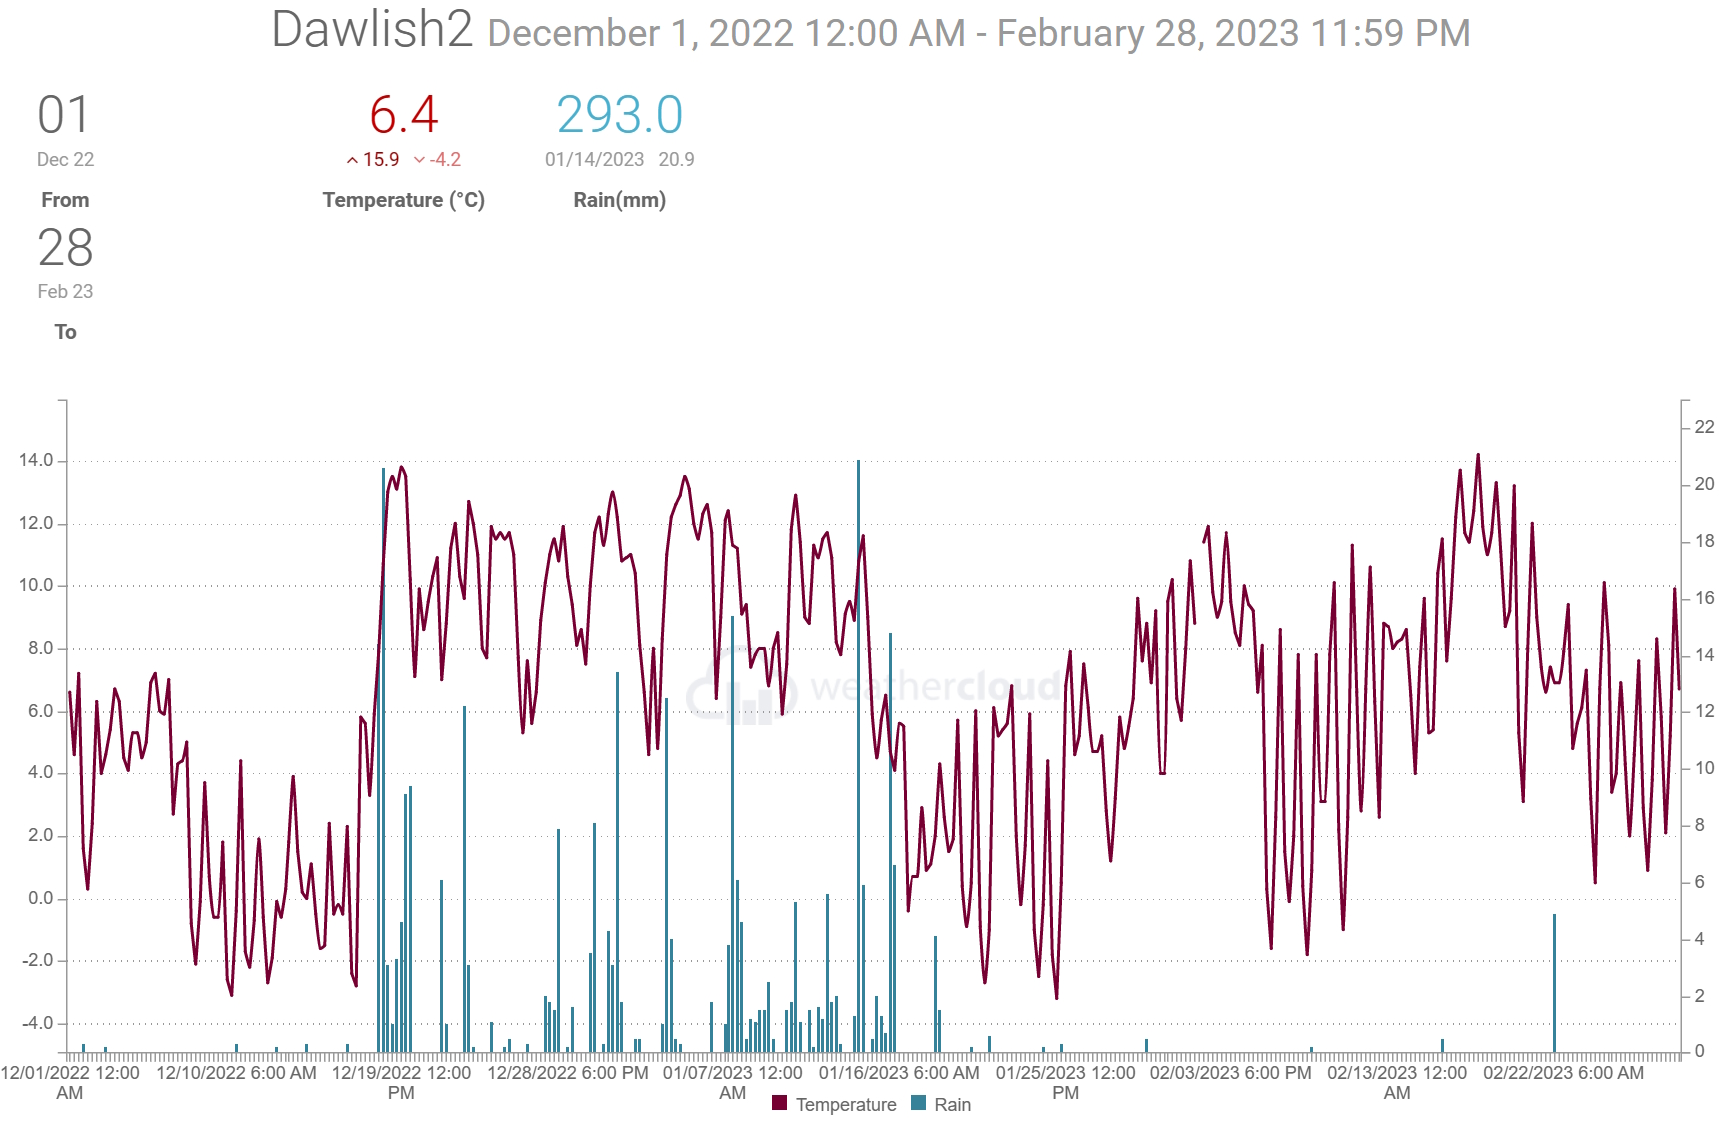
When shown * estimates were made using reports from nearby sites in order to calculate missing data. Grass frost estimates use air temp below 4C
Teignmouth Den*.
Mean temperature 7.2C (LTA 6.7C). Average Max 10C (LTA 9.4C). Average Min 4.6C (LTA 4 C). Air frost 16. (Average 12). Potential 33 ground frosts
Total rain 322mm (LTA 270mm). 44 dry days (LTA 39), 14 days with 1mm or more (LTA 36). 4 day with >= 10mm (LTA 10). 3 days with >= 20mm.
Total sun 208 hours (LTA 209 hours).
Dawlish inland.
Average temp 6.6C. Air frost 28days. Ground frost possible 51 days. Total rain 301mm includes. 54 dry days, 28 days with 1mm or more, 10 days 10mm or more. 5 days 20mm or more. Digital sun 224 hours.
Netherton.
Average temp 5.7C. Air frost 42days. Ground frost possible 60 days. Total rain 372mm. 52 dry days, 29 days with 1mm or more, 12 days 10mm or more, 8 days 20mm or more.
Digital sun 202 hours.
Weather Summary February 2023 02 Mar 2023
High pressure initially to the south of the country produced westerly winds which brought mild air across SW England. The High moved north to be centred over southern England by the 5th and then to France by the 10th. This resulted in a period with light winds, sunny days and clear nights which resulted in widespread frost. The High transferred towards Germany allowing SE and later SW winds to develop as weak weather systems moved in from the west. This brought milder air across Biscay and over SW England leading to the warmest part of the month on the 16th and 17th. During this period afternoon temperatures reached between 15 and 17 Celsius and overnight values were around 10 Celsius. There were some weak weather systems that moved through the High to bring small amounts of rain but the only day with any significant rain was the 21st when a showery trough moved north from Brittany ahead of a weak cold front. This was followed by a wind change to North and later Northeast as High pressure developed across Scotland. This brought colder air across the district and returned frost to many areas.
In terms of statistics:
The average temperature for the month was between 7 and 8 Celsius, around a degree above the thirty-year average for February. The highest temperatures between 15 and 17 Celsius were recorded on the 16th and 17th. For most parts frosts were more frequent than normal with the coldest morning being the 8th when temperatures dipped to between minus 1 and minis 3 Celsius for most parts and as low as minus 6 Celsius in Netherton and in the outskirts of Exeter. Typically there are around 4 nights with a frost in Teignmouth but this February some rural spots recorded as many as 12 nights with an air frost.
Rainfall totals were between 3mm and 7mm, which is less than 10% of the long-term average. There was only one day with 1mm or more of rain and this was the 21st. Recorded rain only fell on 3 or 4 days across the district resulting in double the number of dry days compared to average.
Sunshine was estimated to be above the average of 84 hours.
The sea temperature at the Dawlish wave buoy was just above 8 Celsius at the end of the month.
In summary, February 2023 was an exceptionally dry month with only one day when rain was over 1mm. Despite a number of frosty nights the mean temperature for the month was about a degree above the 30 year (1961-2010) average.
A chart sequence for February 2023 can be viewed here
When shown * estimates were made using reports from nearby sites in order to calculate missing data. Grass frost estimates use air temp below 4C
Teignmouth Den.*
Mean temperature 7.2C (LTA 6.4C). Average Max 10.7C (LTA 9.1C). Highest 14.5C on 16th. Average Min 3.8C (LTA 3.7C). Lowest -1.5C on 10th. Air frost 6 days (Average 4). Potential 13 ground frosts
Total rain 5.2mm (LTA 72mm). 27 dry days (LTA 13), 1 days with 1mm or more (LTA 10). Wettest day 5.2mm on the 21/0900 to 22/0900 hours next day. 0 day with >= 10mm (LTA 2.5). 0 days with >= 20mm.
Total sun 101.5* hours (LTA 83.5 hours).
Dawlish inland.
Average temp 7.3C. Air frost 7days. Ground frost possible 17 days. Highest 16C on 16th. Lowest -2.5C morning of 8th. Total rain 6mm. 25 dry days, 1 days with 1mm or more, 0 days 10mm or more. 0 days 20mm or more. Wettest day 4.8mm 21st.
Digital sun 94 hours (correction factor 0.0) = 94 hours.
Teignmouth Inland.
Average temp 7.4C. Air frost 4days. Ground frost possible 13 days. Highest 14.8C on 17th. Lowest -1.7C morning of *8th. Total rain 7.6mm. 24 dry days, 1 days with 1mm or more, 0 days 10mm or more, 0 days 20mm or more. Wettest day 5.1mm 21st.
Digital sun 95 hours (correction factor 1) = 95 hours.
Netherton.
Average temp 6.3C. Air frost 12days. Ground frost possible 22days. Highest 14.5C on 17th. Lowest -5.8C morning of 8th. Total rain 6.1mm. 24 dry days, 1 days with 1mm or more, 0 days 10mm or more, 0 days 20mm or more. Wettest day 4.1mm 21st.
Digital sun 92 hours (correction factor 1) = 92 hours.
Weather Summary January 2023 01FEB2023
The first half of January 2023 was mostly unsettled as wet and at times windy weather spread across SW England. This was associated with a run of Atlantic low pressure weather systems and winds frequently from a west or southwest direction. Notably wet days were the 3rd, 7th, 14th and 15th. On the night of the 15th into the 16th a low-pressure system moved SE across Devon bringing some snow across the hills and moors as colder air moved in from the north. On the 18th cold showery northwest winds brought a temporary covering of soft hail and snow to parts of Dawlish as well as higher parts of the district. From the 19th high pressure took charge of the weather patterns and because of the cold air across the district this was the start of a rather frosty period for many parts of the district. Although this second half of the month was mostly dry there where a few days with some showery rain associated with weak fronts that moved around the high. Milder air and a return of westerly winds reached the area near the end of the month.
In terms of statistics:
The average temperature for the month was around 6 or 7 Celsius, which is close to the thirty year average for January. The highest temperature of the month was around 14 Celsius, occurring on the 4th. There were frequent frosts in the second half of the month with the coldest mornings on the 21st or 25th when a low of minus 3 Celsius was quite widespread and values as low as minus 5 Celsius were recorded in the Netherton and Exminster area. Even coastal areas experienced air frost on these days. On average there are around 4 nights with an air frost in January, but this year there were between 6 and 9 night frosts although near Exminster and Netherton there were 10 and 13 days, respectively.
Rainfall totals were typically between 100 and 160mm, that’s about 30% more than average. The wettest days were the 3rd, 7th, 14th and 15th with 40 to 60mm falling on 14th and 15th combined. Despite being a wetter than average month in terms of rainfall totals, there were between 11 and 15 dry days, which is close to the average. There were between 12 and 16 days with recorded rain of 1mm or more (average around 13) and 2 to 5 days with 10mm or more and a few days with 20mm or more.
Strong winds occurred on the 3rd, 5th, 6th, 7th, 11th, 12th and 13th.
Sunshine was estimated to be near or a little below in the south of the district and above average in the north (55 to 80 hours average 65 hours). update 2/2/23.
The sea temperature off Dawlish was just below 9 Celsius at the end of the month.
In summary, January 2023 rainfall totals were around 30% higher than average. The temperature for the month was close to the 30-year average despite more frequent days with a frost. Sunshine was near average.
A chart sequence for January 2023 can be viewed here
When shown * estimates were made using reports from nearby sites in order to calculate missing data. Grass frost estimates use air temp below 4C
Teignmouth Den. Added 2/2/23
Mean temperature 5.6C (LTA 6.7C). Average Max 10C (LTA *9.4C). Highest 13.9C on 4th. Average Min 1.3C (LTA 4C). Lowest -1.7C on 26th. Air frost 13. (Average 4). Potential 25 ground frosts
Total rain 156mm (LTA 95mm). 15 dry days (LTA 12), 15 days with 1mm or more (LTA 13). Wettest day 30mm on the 13th 0900 to 0900 hours next day. 4 days with >= 10mm (LTA 4). 3 days with >= 20mm.
Total sun 55 hours (LTA 65 hours).
Dawlish inland.
Average temp 6.7C. Air frost 8 days. Ground frost possible 17 days. Highest 14.1C on 4th. Lowest -3.3C morning of 21st/25th. Total rain 150mm includes few mm of soft hail/snow on the 18th, full cover in shower soon melting. 11 dry days, 15 days with 1mm or more, 5 days 10mm or more. 2 days 20mm or more. Wettest day 27mm 7/14th .
Digital sun 41 hours (correction factor 2) = 82 hours.
MET OFFICE chart SUN 70-80hours+ 120% anomaly.
Teignmouth Inland.
Average temp 6.5C. Air frost 6 days. Ground frost possible 13 days. Highest 14C on 4th. Lowest -2.5C morning of 25th. Total rain 130mm. 10 dry days, 15 days, with 1mm or more, 4 days 10mm or more, 2 days 20mm or more. Wettest day 23.6mm 7th .
Digital sun 57 hours (correction factor 1.5) = 87* hours.
Netherton.
Average temp 5.8C. Air frost 13days. Ground frost possible 19 days. Highest 14C on 4th. Lowest -5.5C morning of 21st. Total rain 166mm. 10 dry days, 15 days with 1mm or more, 5 days 10mm or more, 4 days 20mm or more. Wettest day 30mm 14th .
Digital sun 24 hours (correction factor 2.5) = 60 hours.